Chapter 14 – Data Standards and Quality
I have 25 years of computer programming experience so I am quite familiar with the issue of data quality. Even more applicable is my extensive experience with “interchanging data” between systems. This arises when old systems are replaced with new systems, or when off-the-shelf software package are integrated with an existing system.
The author introduces the issue on page 468 under the topic “format standards”. It applies to attribute data more than to spatial data. However, I don’t think he specifically addresses this problem that I have encountered.
An example might be when a city is changing their software package and the new system allows for 10 values for “types of light poles”, whereas the old system only allowed for 6 values. When the new system is installed the old data must be mapped to the new system but there might be some confusion as to how to correctly map the old values to the new. And, as the new system is used the workers might continue to use the old values and introduce inconsistency into the data values.
This is closely related to the issue of data standards because strict definitions of every field of data are very important, and training of the personnel using the system and entering data is critical to data integrity. The data is only as good as the people who enter it and maintain it.
I found the whole topic of measuring data quality very interesting because I have never worked in an environment where the data could be accurately tested for accuracy. For example, I have worked in hospitals where the patient treatment is coded by trained personnel. However, there was no easy way to verify that the recorded treatment is accurate because the physician’s notes might be wrong, and the physician’s memory and the nurses’ memories might be in error, and the patient may not know exactly what was done to him. This contrasts sharply with spatial data where the actual real-world position of an object can be tested.
It was good to see that the federal government has established meta-data standards for spatial data (SDTS, Spatial Data Transfer Standard), and for measuring spatial data accuracy (NSSDA). However, the book points out that it is expensive to measure this. Usually, government bodies would rather go out and collect more data than go back and check their existing data. Test points must be established and checked against. And the NSSDA only applies to point accuracy, and not to line features or polygons.
There are four main ways to check spatial data accuracy: positional, attribute, logical consistency and completeness. Actually, now that I’m writing this I think the author might categorize my opening comments as “logical consistency” or “attribute” errors. The book uses an aerial photo to clearly describe the four issues. The physical position of the houses in the photo might be inaccurate, or houses might be labeled as garages, or a building in the photo might be completely left out of the data, or, finally, items might be illogically stored in the data, for example, light poles might be in the middle of a street. If data is missing that is a problem of ‘completeness’. This may be caused by the minimum mapping unit being to big. Features smaller than the minimum mapping unit will be left out. Or, perhaps the data is not current and new features have been added or removed that are not reflected.
The book establishes a distinction between accuracy and precision. Precision indicates that the data items are consistent but they may be inaccurate. Accuracy indicates how close a data item is to the true location. Sometimes precision errors may occur because of a bias being introduced by something like equipment problems. The Federal Geographic Data Committee (FGDC) ahd set a standard method for measuring data accuracy. There are five steps to this process of the FSSDA. First, select test points, 2. define independent control data set, 3. collect measurements from both sources, 4. calculate positional accuracy statistic, 5. report the accuracy statistic in a standardized form included in the metadata.
To measure the accuracy of point data the distance formula, or Pythagorean theorem is used to measure the distance from the true location and the data location. This length of this distance is the margin of error for the data.
As mentioned previously, there is no established standard for accuracy of linear features, only for data points. One common approach is to define a epsilon band. This might be defined as a margin of error for the accuracy of a line.
Another interesting point mentioned is that format standards have been lacking and vendor standards have filled the void. Specifically, ESRI shapefiles and interchange files were a common format for years. However, the lack of official standards left room for these vendors to change things on their whim and introduce problems for the whole field of GIS. The new emerging standards will tighten this up and hold everyone to a common interchangeable data model.
Another interesting point is that the rapid blossoming of GIS systems and data in just the past twenty years has caused an increase in the study of data accuracy. Academic researchers have been studying spatial data quality for a long time. But it is only recently that it has intensified. Some of the measurements used to measure data accuracy are: average distance error, total area that is classified incorrectly, biggest distance error or, the percent of data points that are in error.
This is an important topic. Now if only the media and news organizations would try to establish a similar standard for the accuracy of their reporting. We could judge what newspapers and TV news broadcasts are reliable!!!
Thursday, December 13, 2007
Sunday, December 9, 2007
Sunday, Dec 9th, 2007

Once again, I had to completely re-create my map from scratch. This time it as in class from the work that I did at home last weekend. Usually, it's when I get home and try to use a map that I created in class.
I am getting better at it, however. This time the only thing missing was the clip of the raster layer for hillshade. When I tried to re-create that layer I couldn't find Spatial Analyzer on my PC. I'm sure that I installed every extension when I set up ArcGIS. I remember quite clearly. There must be some 'setup' issue. I will figure it out and then reclip the raster layer. I appreciate you showing me how to do that, Pete. That was cool.
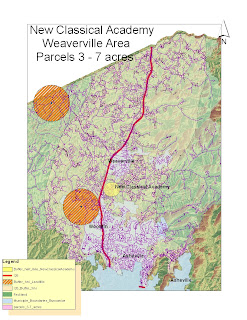
Anyway, there is my map for the New Classical Academy issue. It shows all the parcels 3-7 acres in size, within 3 miles of I-26 and not within 1 mile of a landfill. I finally got a response from them. Although they were appreciative, they told me they are in negotiation with someone for a purchase. If it falls through they'll get back to me. I also sent them an Excel spreadsheet with the attribute data, including addresses. I thought they could do a mailing from that. Even if someone does not have their property up for sale, they might consider selling it, or part of it if they knew it was a school interested.
Saturday, December 1, 2007
Sat Dec 1st, 2007
I didn't think the test was too bad (haven't seen my grade yet). I found this the hardest test to study for. I'm not sure why. I found some of the study guide questions a tad confusing. Or, at least I found it hard to locate an answer in the textbook. Also, I don't think we covered much of it in class lecture so reading it in the textbook was like hearing it for the first time, rather than a refresher.
However, I found the lab part of the test to be fairly straightforward and not difficult. And I must say that I really didn't prepare for it. I guess I'm just starting to remember what I'm doing, somewhat.
One very annoying thing that has happened with every lab is that when I get home and try to work on my map it does not work. Part of the problem is the mapping of the drives, I think. I assume that I did not remove the drive letter from the path (which you told us to do). However, it should be able to easily correct that by remapping the drive in ArcMap. On the contrary, even after re-directly ArcMap to look at the correct drive my map still gets messed up. Tonight I don't feel like fighting this, even though I stupidly did not do a final save on my map before I exported it as a jpg file. So, I'm just going to post my map without the nice legend and heading, etc. that I put on it in class. I don't feel like battling this thing tonight. I thought it would only take me a minute to add it again but instead I ended up struggling to just get the map working a little.
Saturday, November 17, 2007
Sat. Nov 17th, 2007
Friday's lab was a much needed refresher. It was frustrating downloading the parcels data (took an hour). I had my map nearly completed in class but when I got it home to was almost completely screwed up and required several frustrating hours of re-work. Things work much differently from the flash drive than than do in class. It shouldn't be the case because I was working strictly from my flashdrive in class and had all the data save there but all I got initially were red exlamation points next to my layers at first.
I was impressed by how much work was devoted to GIS day and I thought it went off very well. However, I found it discouraging as far as the prospects of employment in Asheville. From speaking with a young woman from the NCDC, I found out that most people there are hired from UNCA's Masters in Meteorology program. I'm sure there are jobs around the nation but few locally. I spoke with Jason Mann, from MapAsheville, and he said they had increased employment by 200% in the past year....they had gone from zero to two GIS employees. That was meant to be funny but I found it somewhat pitiful. He also told me that they had still not hired anyone for the job posted last summer. The pay was only $29K and yet people with PhD's had applied, and some from as far away as England. About 150 people applied.
I forgot to post my map from the week before GIS day, so I'll post that now too.
Sunday, October 14, 2007
Sunday, Oct 14th Chap 10, 11 exercises


The test wasn't so bad but there were a couple that I just wasn't sure about. For example the last question: what are the two table types. Ya got me.
I mostly studied from the book so I couldn't remember what Isopleth maps are, even though I remember you mentioning that word one day.
This weeks exercises were quite interesting...clipping data, etc.
Subscribe to:
Comments (Atom)


